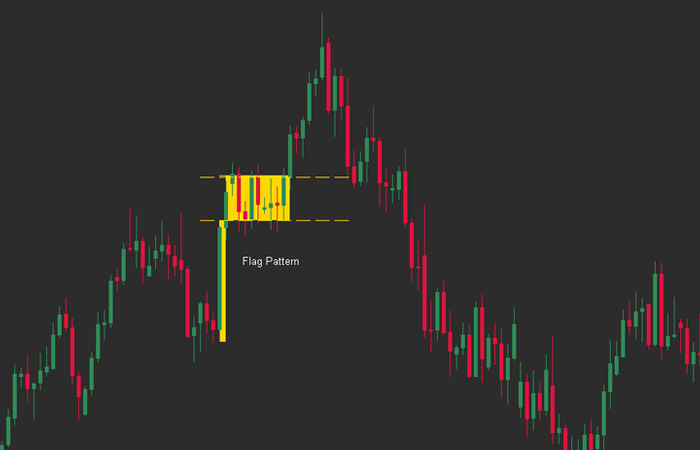
This flag chart pattern is a breakout buy signal with three major elements: the trend before the rectangular flag pattern, the pause in price during the rectangle, and the strong price break out after prices breakout through the top or bottom of the rectangle. This asset’s most recent flag was formed in December 2017. This gives us an opportunity to enter this asset at a better price than before the flag.
Here we have a flag chart pattern and you can see how the price paused in the rectangular range, going mostly sideways. The formation was perfect for us and after the break out we can now take a position in the trend at a better price than it first offered, as well as getting into the trend earlier than we could have originally. The flag chart pattern is a continuation pattern that allows traders to join a trend near the beginning of the price move, after the market has consolidated for several weeks. This gives us a lower risk entry point that better allows us to join in on trends.
Seeing flag patterns in the markets can be tricky. They are formed at a time when a trend is going in the opposite direction–the flag is pointing down, then reverses and points up. At times, it can be hard to pick out the beginning of a flag or even see it because of this contrast in direction. But once you see the pattern developing, it helps to define precisely where buyers and sellers are at in the current trend and can help you trade with better precision.
Flag Patterns Chart are one of the most traded chart patterns. They signify to traders that a price has paused and is heading in a new direction. They are very similar to triangles but with a key difference: The price breaks out from the triangle or flag, then resumes its original strong trend, giving us a better entry point in the market than we would have had without the breakout.A flag pattern occurs in an uptrend or downtrend. One horizontal line is drawn from the highest price point of the trend, another from the lowest price point. The size of the rectangle should be “relatively” equal on both sides, with a portion of the rectangle sticking out (which becomes the flag pole.)
Flags are one of the most common patterns used in technical analysis as a reversal. These patterns normally consist of three ‘waves’. The first wave is the longest and makes up most of the price action. It should be around 1 to 1.618 times longer than it’s ‘flagpole’ length. The second wave usually breaks the trendline where the flag pole met the trend line, signaling the start of a trend reversal. It should be around 1 to 1.618 times shorter than the wave before it, giving us an opportunity to enter at a different point in trend then we would have had we just entered right after wave one. That wave should never go below the beginning flag pole and be equal or less time than wave one (1-1.618). If it does, then simply wait for another flag formation to enter the market.